Translate

Bag Filter

Bag Filter- It is used only low teperature application. The cleaned gas will goes through chimney to out and the dust will collect at the hopper

Cyclone

Cyclone- It is used for another types of dust cleaning from gas.

ESP

ESP- Electrostatic Precipitator

ESP

ESP-Electrostatic precipitator. it is most commonly used Dust cleaning machine from Gas. It is Used High temperature application .

Wet Scrubber

Wet Scrubbber- It is used in chemical factories to remove hazardes chemicals from the gas.

Showing posts with label ESP-Operation and Maintanace. Show all posts

Monday, February 2, 2015

Safety

Persons who will be operating and maintaining an ESP must be well trained on all safety
aspects to avoid injury. One person at the plant should be assigned the responsibility of constantly
checking safety standards and equipment and to train or procure safety training for all
those who will work with the ESP. A suggested list of important safety precautions is listed in
Table

                                                        Important safety precautions

Air Inleakage

Inleakage is often overlooked as an operating problem. In some instances, it can be beneficial
to ESP performance, but in most cases its effect is detrimental. Inleakage may occur
within the process itself or in the ESP and is caused by leaking access doors, leaking ductwork,
and even open sample ports.
Inleakage usually cools the gas stream, and can also introduce additional moisture. Air
inleakage often causes localized corrosion of the ESP shell, plates, and wires. The temperature
differential also can cause electrical disturbances (sparking) in the field. Finally, the
introduction of ambient air can affect the gas distribution near the point of entry. The primary
entrance paths are through the ESP access and hopper doors. Inleakage through hopper
doors may reentrain and excessively cool the dust in the hopper, which can cause both
reentrainment in the gas stream and hopper pluggage. Inleakage through the access doors
is normally accompanied by an audible in-rush of air.
Inleakage is also accompanied by an increase in gas volume. In some processes, a certain
amount of inleakage is expected. For example, application of Lungstrom regenerative air
heaters on power boilers or recovery boilers is normally accompanied by an increase in
flue gas oxygen. For utility boilers the increase may be from 4.5% oxygen at the inlet to
6.5% at the boiler outlet. For other boilers the percentage increase may be smaller when
measured by the O2 content, but 20 to 40% increases in gas volumes are typical and the
ESP must be sized accordingly. Excessive gas volume due to air inleakage, however, can
cause an increase in emissions due to higher velocities through the ESP and greater reentrainment
of particulate matter. For example, at a kraft recovery boiler, an ESP that was
designed for a superficial velocity of just under 6 ft/s was operating at over 12 ft/s to handle
an increased firing rate, increased excess air, and inleakage downstream of the boiler.
Because the velocities were so high through the ESP, the captured material was blown off
the plate and the source was unable to meet emission standards.

Table  summarizes the problems associated with electrostatic precipitators, along with
corrective actions and preventive measures.


Changes in Particle Size

Unusually fine particles present a problem under the following circumstances:
1. When the ESP is not designed to handle them
2. When a process change or modification shifts the particle size distribution into the
range where ESP performance is poorest.
A shift in particle size distribution tends to alter electrical characteristics and increase the
number of particles emitted in the light-scattering size ranges (opacity).

There are two principal charging mechanisms: field charging and
diffusion charging. Although field charging tends to dominate in the ESP and acts on particles
greater than 1 micrometer in diameter, it cannot charge and capture smaller particles.
Diffusion charging, on the other hand, works well for particles smaller than 0.1 micrometer
in diameter. ESP performance diminishes for particulates in the range of 0.2 - 0.9
micrometer because neither charging mechanism is very effective for particles in this
range. These particles are more difficult to charge and once charged, they are easily
bumped around by the gas stream, making them difficult to collect. Depending upon the
type of source being controlled, the collection efficiency of an ESP can drop from as high
as 99.9% on particles sized above 1.0 micrometer or below 0.1 micrometer, to only 85 to
90% on particles in the 0.2 - 0.9 micrometer diameter range. If a significant quantity of
particles fall into this size range, the ESP design must be altered to accommodate the fine
particles.

When heavy loadings of fine particles enter the ESP, two significant electrical effects can
occur: space charge and corona quenching. At moderate resistivities, the space-charge
effects normally occur in the inlet or perhaps the second field of ESPs. Because it takes a longer time to charge fine particles and to force them to migrate to the plate, a cloud of
negatively charged particles forms in the gas stream. This cloud of charged particles is
called a space charge. It interferes with the corona generation process and impedes the
flow of negatively charged gas ions from the wire to the collection plate. The interference
of the space charge with corona generation is called corona quenching.When this occurs,
the T-R controller responds by increasing the operating voltage to maintain current flow
and corona generation. The increase in voltage usually causes increased spark rates, which
may in turn signal the controller to reduce the voltage and current in an attempt to maintain
a reasonable spark rate. Under moderate resistivity conditions, the fine dust particles
are usually collected by the time they reach the third field of the ESP which explains the
disappearance of the space charge in these later fields. The T-R controller responds to the
cleaner gas in these later fields by decreasing the voltage level, but the current levels will
increase markedly. When quantities of fine particles being processed by the ESP increase,
the space charging effect may progress further into the ESP.

Misalignment

Electrode misalignment is both a contributor to and a result of component failures. In general, most ESPs are not affected by a misalignment of less than about 3/16 inches. Indeed, some tolerance must be provided for expansion and contraction of the components. Beyond this limit, however, misalignment can become a limiting factor in ESP performance and is visually evident during an internal inspection of the ESP electrodes.Whether caused by warped plates, misaligned or skewed discharge electrode guide frames, insulator failure, or failure to maintain ESP "boxsquareness," misalignment reduces the operating voltage and current required for sparking. The V-I curve would indicate a somewhat lower voltage to achieve a low current level with the sparking voltage and current greatly reduced. Since the maximum operating voltage/ current levels depend on the path of least resistance in a field, any point of close tolerance will control these operating levels.

Hopper Pluggage

Perhaps no other problem (except fire or explosion) has the potential for degrading ESP
performance as much as hopper pluggage. Hopper pluggage can permanently damage an
ESP and severely affect both short-term and long-term performance. Hopper pluggage is difficult to diagnose because its effect is not immediately apparent on the T-R set panel
meters. Depending on its location, a hopper can usually be filled in 4 to 24 hours. In many
cases, the effect of pluggage does not show up on the electrical readings until the hopper is
nearly full.
The electrical reaction to most plugged hoppers is the same as that for internal misalignment,
a loose wire in the ESP, or excessive dust buildup on the plates. Typical symptoms
include heavy or "bursty" sparking in the field(s) over the plugged hopper and reduced
voltage and current in response to the reduced clearance and higher spark rate. In
weighted-wire designs, high dust levels in the hopper may raise the weight and cause slack
wires and increased arcing within the ESP. In many cases, this will trip the T-R set off-line
because of overcurrent or undervoltage protection circuits. In some situations, the sparking
continues even as the dust level exceeds hopper capacity and builds up between the
plate and the wire; whereas in others, the voltage continues to decrease as the current
increases and little or no sparking occurs. This drain of power away from corona generation
renders the field performance virtually useless. The flow of current also can cause the
formation of a dust clinker (solidified dust) resulting from the heating of the dust between
the wire and plate.
The buildup of dust under and into the collection area can cause the plate or discharge
electrode guide frames to shift. The buildup can also place these frames under enough
pressure to distort them or to cause permanent warping of the collection plate(s). If this
happens, performance of the affected field remains diminished by misalignment, even
after the hopper is cleared.

Hopper pluggage can be caused by the following:
• Obstructions due to fallen wires and/or bottle weights
• Inadequately sized solids-removal equipment
• Use of hoppers for dust storage
• Inadequate insulation and hopper heating
• Air inleakage through access doors
Most dusts flow best when they are hot, therefore, cooling the dusts can promote a hopper
pluggage problem.
Hopper pluggage can begin and perpetuate a cycle of failure in the ESP. For example,
there was a case where a severely plugged hopper misaligned both the plates and the wire
guide grid in one of the ESP fields. Because the performance of this field had decreased,
the ESP was taken off-line and the hopper was cleared. But no one noticed the deteriorated
condition of the wire-guide grid. The misalignment had caused the wires and weight
hooks to rub the lower guide and erode the metal. When the ESP was brought back online,
the guide-grid metal eventually wore through. Hopper pluggage increased as weights
(and sometimes wires) fell into the hopper, plugging the discharge opening and causing
the hopper to fill again and cause more misalignment. The rate of failure continued to
increase until it was almost an everyday occurrence. This problem, which has occurred
more than once in different applications, demonstrates how one relatively simple problem
can lead to more complicated and costly ones.
In most pyramid-shaped hoppers, the rate of buildup lessens as the hopper is filled due to
the geometry of the inverted pyramid. Hopper level indicators or alarms should provide some margin of safety so that plant personnel can respond before the hopper is filled.
When the dust layer rises to a level where it interferes with the electrical characteristics of
the field, less dust is collected and the collection efficiency is reduced. Also, reentrainment
of the dust from the hopper can limit how high into the field the dust can go. Although
buildups as deep as 4 feet have been observed, they usually are limited to 12 - 18 inches
above the bottom of the plates.

Wire Breakage

Some ESPs operate for 10 to 15 years without experiencing a single wire breakage.
Whereas others experience severe wire breakage problems causing one or more sections to
be out of service nearly every day of operation. Much time and effort have been expended to determine the causes of wire breakage. One of the advantages of rigid-frame and rigid electrode
ESPs is their use of shorter wires or no wires at all. Although most new ESPs
have either rigid frames or rigid electrodes, and some weighted-wire systems have been
retrofitted to rigid electrodes, the most common ESP in service today is still the weighted wire.
Wires usually fail in one of three areas: at the top of the wire, at the bottom of the wire,
and wherever misalignment or slack wires reduce the clearance between the wire and
plate. Wire failure may be due to electrical erosion, mechanical erosion, corrosion, or
some combination of these. When wire failures occur, they usually short-out the field
where they are located. In some cases, they may short-out an adjacent field as well. Thus,
the failure of one wire can cause the loss of particle collection in an entire field or bus section.
In some smaller ESP applications, this can represent one-third to one-half of the
charging/collecting area and thus substantially limit ESP performance. One of the advantages
of higher sectionalization is that wire failure is confined to smaller areas so overall
ESP performance does not suffer as much. Some ESPs are designed to meet emission
standards with some percentage of the ESP de-energized, whereas others may not have
any margin to cover downtime. Because they receive and remove the greatest percentage
of particulate matter, inlet fields are usually more important to ESP operation than outlet
fields.

Electrical erosion is caused by excessive sparking. Sparking usually occurs at points
where there is close clearance within a field due to a warped plate, misaligned guidance
frames, or bowed wires. The maximum operating voltage is usually limited by these close
tolerance areas because the spark-over voltage depends on the distance between the wire
and the plate. The smaller the distance between the wire and plate, the lower the sparkover
voltage. Under normal circumstances random sparking does little damage to the ESP.
During sparking, most of the power supplied to energize the field is directed to the location
of the spark, and the voltage field around the remaining wires collapses. The considerable
quantity of energy available during the spark is usually sufficient to vaporize a
small quantity of metal. When sparking continues to occur at the same location, the wire
usually "necks down" because of electrical erosion until it is unable to withstand the tension
and breaks. Misalignment of the discharge electrodes relative to the plates increases
the potential for broken wires, decreases the operating voltage and current because of
sparking, and decreases the performance potential of that field in the ESP.
Although the breakage of wires at the top and bottom where the wire passes through the
field can be aggravated by misalignment, the distortion of the electrical field at the edges
of the plate tends to be the cause of breakage. This distortion of the field, which occurs
where the wire passes the end of the plate, tends to promote sparking and gradual electrical
erosion of the wires.

Design faults and the failure to maintain alignment generally contribute to mechanical
erosion (or wear) of the wire. In some designs, the lower guide frame guides the wires or
their weight hooks (not the weights themselves) into alignment with the plates. When
alignment is good, the guide frame or grid allows the wires or weight hooks to float freely
within their respective openings. When the position of the wire guide frame shifts, however,
the wire or weight hook rubs the wire frame within the particulate-laden gas stream.
Failures of this type usually result from a combination of mechanical and electrical erosion.
Corrosion may also contribute to this failure. Microsparking action between the guide frame and the wire or weight hook apparently causes the electrical erosion. The
same type of failure also can occur in some rigid frame designs where the wires ride in the
frame.
Another mechanical failure that sometimes occurs involves crossed wires. When replacing
a wire, maintenance personnel must make sure that the replacement wire does not
cross another wire. Eventually, the resulting wearing action breaks one or both wires. If
one of the wires does survive, it is usually worn down enough to promote greater sparking
at the point of contact until it finally does break. Any wires that are found to be exceptionally
long and slack should be replaced; they should not be crossed with another wire to
achieve the desired length.

Corrosion of the wires can also lead to wire failures. Corrosion, an electrochemical reaction,
can occur for several reasons, the most common being acid dew point.When the rate
of corrosion is slow and generally spread throughout the ESP, it may not lead to a single
wire failure for 5 to 10 years.When the rate of corrosion is high because of long periods of
operating the ESP below the acid dew point, failures are frequent. In these cases the corrosion
problem is more likely to be a localized one (e.g., in places where cooling of the gas
stream occurs, such as inleakage points and the walls of the ESP). Corrosion-related wire
failures can also be aggravated by startup-shutdown procedures that allow the gas streams
to pass through the dew point many times. Facilities have mainly experienced wire breakage
problems during the initial process shakedown period when the process operation may
not be continuous. Once steady operation has been achieved, wire breakage problems tend
to diminish at most plants.

Wire crimping is another cause of wire failure. Crimps usually occur at the top and bottom
of the wires where they attach to the upper wire frame or bottle weight; however, a
crimp may occur at any point along the wire. Because a crimp creates a residual stress
point, all three mechanisms (electrical erosion, mechanical erosion, and corrosion) may be
at work in this situation. A crimp can:
1. Distort the electric field along the wire and promote sparking;
2. Mechanically weaken the wire and make it thinner;
3. Subject the wire to a stress corrosion failure (materials under stress tend to corrode
more rapidly than those not under stress).
Wire failure should not be a severe maintenance problem or operating limitation in a welldesigned
ESP. Excessive wire failures are usually a symptom of a more fundamental problem.
Plant personnel should maintain records of wire failure locations. Although ESP performance
will generally not suffer with up to approximately 10% of the wires removed,
these records should be maintained to help avoid a condition in which entire gas lanes may
be de-energized. Improved sectionalization helps to minimize the effect of a broken wire
on ESP performance, but performance usually begins to suffer when a large percentage of
the ESP fields are de-energized.

Friday, January 30, 2015

Dust Accumulation

There are three primary causes of dust accumulation on electrodes:
• Inadequate rapping system
• Stickydust
• Operation at temperatures below the dew point level
The usual cause for buildup of dust on the collection plates or discharge wires is failure of
the rapping system or an inadequate rapping system. The rapping system must provide
sufficient force to dislodge the dust without damaging the ESP or causing excessive reentrainment.
The failure of one or two isolated rappers does not usually degrade ESP performance
significantly. The failure of an entire rapper control system or all the rappers in one
field, however, can cause a noticeable decrease in ESP performance, particularly with
high-resistivity dust. Therefore, rapper operation should be checked at least once per day,
or perhaps even once per shift. A convenient time to make this check is during routine T-R
set readings.
Rapper operation may be difficult to check on some ESPs because the time periods
between rapper activation can range from 1 to 8 hours on the outlet field. One method of
checking rapper operation involves installing a maintenance-check cycle that allows a
check of all rappers in 2 to 5 minutes by following a simple rapping pattern. The cycle is
activated by plant personnel, who interrupt the normal rapping cycle and note any rappers
that fail to operate. After the check cycle, the rappers resume their normal operation.
Maintenance of rapper operation is important to optimum ESP performance.
Excessive dust buildup also may result from sticky dusts or operation at gas dew point
conditions. In some cases, the dusts may be removed by increasing the temperature, but in
many cases the ESP must be entered and washed out. If sticky particulates are expected
(such as tars and asphalts), a wet-wall ESP is usually used because problems can occur
when large quantities of sticky particles enter a dry ESP.
Sticky particulates can also become a problem when the flue gas temperature falls below
the dew point level. Although acid dew point is usually of greater concern in most applications,
moisture dew point is important, too. When moisture dew point conditions are
reached, liquid droplets tend to form that can bind the particulate to the plate and wire.
These conditions also accelerate corrosion. Carryover of water droplets or excessive moisture
can also cause this problem (e.g., improper atomization of water in spray cooling of
the gas or failure of a waterwall or economizer tube in a boiler). In some instances the dust
layer that has built up can be removed by increasing the intensity and frequency of the rapping
while raising the temperature to "dry out" the dust layer. In most cases, however, it is necessary to shutdown the unit and wash out or "chisel out" the buildup to clean the plates.
Localized problems can occur where inleakage causes localized decreases in gas temperature.
In an operating ESP, differences in the V-I curves can be used to evaluate if a dust buildup
problem exists. Buildup of material on the discharge electrodes often means an increase in
voltage to maintain a given operating current. The effect of dust buildup on discharge electrodes
is usually equivalent to increasing the effective wire diameter. Since the corona
starting voltage is strongly a function of wire diameter, the corona starting voltage tends to
increase and the whole V-I curve tends to shift to the right (see Figure ). Sparking tends
to occur at about the same voltage as it does without dust buildup, unless resistivity is
high. This effect on corona starting voltage is usually more pronounced when straight
wires are uniformly coated with a heavy dust, and less pronounced on barbed wires and
rigid electrodes or when the dust layer is not uniform. Barbed wires and rigid electrodes
tend to keep the "points" relatively clean and to maintain a small effective wire diameter
and, therefore, a low corona starting voltage. Nevertheless, a higher voltage would still be
required to spread the corona discharge over the wire when dust buildup occurs. Thus,
buildup on the discharge electrodes would still be characterized by a higher voltage to
maintain a given current level.
V-I curve for a field with excessive wire
buildup

Typical High, Normal and Low Resistivity Curves

Evaluating the current and spark rate trends from the inlet to the outlet fields provides
a means of evaluating the general resistivity conditions. Moderate dust resistivity conditions,
under which ESPs work very well, are indicated by low secondary currents in
the inlet field and progressively higher values going toward the outlet. Spark rates
under moderate resistivity are moderate in the inlet fields and decrease to essentially
zero in the outlet field. High resistivity conditions are indicated by low secondary currents
in all of the fields coupled with very high spark rates. Conversely, low resistivity
has very high currents and low spark rates in all the fields.

Figure 1 shows the typical trend lines for moderate (normal) and high resistivity
dusts. As the resistivity goes from moderate to high, the currents decrease dramatically
in all of the fields. This is due to the suppressing effect caused by the strong electrostatic
field created on the dust layer, and to increased electrical sparking. The
decrease in currents is most noticeable in the outlet fields which previously had relatively
high currents. Spark rates increase dramatically during high resistivity. Often
most of the fields will hit the spark rate limits programmed in by the plant operators.
Once the spark rate limit is sensed by the automatic voltage controllers, it no longer
attempts to drive up the voltage. This causes a reduction in the operating voltages of
these fields. The overall impact on the opacity is substantially increased emissions. In
some cases, puffing again occurs during rapping. This is due to reduced capability of
the precipitator fields to collect the slight quantities of particles released during rapping
of high resistivity dust.

Figure 2 shows the typical trend lines for moderate (normal) and low resistivity
dusts in a four-field ESP. The moderate resistivity dust shows a steady increase of current
from the first field to the fourth field, while the secondary current increases rapidly
for all fields when the dust exhibits low resistivity. This effect is especially
noticeable in the inlet fields which previously had the lowest currents. This increase in
current is due simply to the fact that the dust layer’s electrostatic field is too weak to
significantly impede the charging field created by the discharged electrodes. At low
resistivity, the spark rates are generally very low or zero. The voltages in all of the
fields are a little lower than normal since the automatic voltage controllers sense that
the power supply is at its current limit; therefore, the controller does not attempt to
drive the voltage up any further. While the low resistivity conditions persist, there can
be frequent and severe puffs (opacity increase) which occur after each collection plate
rapper activates.

Figure 1. Typical T-R set plots - high resistivity versus moderate (normal)
resistivity

Figure 2. Typical T-R set plots - low resistivity versus moderate (normal)
resistivity

Using the current, voltage, and spark rate plots is a very good way to use readily available
information to evaluate the impossible-to-directly monitor but nevertheless
important resistivity conditions. It is possible to differentiate between problems
caused by mechanical faults in a single field (such as insulator leakage) and resistivity
conditions which inherently affect all of the fields in varying degrees. However, these
trend lines are not a perfect analysis tool for evaluating resistivity. A few precipitators
never display typical electrical trend lines since they have undersized T-R sets, undersized
fields, improperly set automatic voltage controllers, or severe mechanical problems
affecting most of the fields.

Problems Related to Resistivity

The resistivity of the collected dust on the collection plate affects the acceptable current
density through the dust layer, dust removal from the plates, and indirectly, the corona
charging process. High resistivity conditions in utility fly ash applications have received
much attention. The optimum resistivity range for ESP operation is relatively narrow; both
high and low resistivity cause problems. Excursions outside the optimum resistivity range
are particularly a problem when a unit is designed with a modest amount of plate area, sectionalization,
and power-input capabilities. At industrial sources where resistivity changes
are intermittent, modification of operating procedures may improve performance temporarily.
Expensive retrofitting or modifications may be required if the dust resistivity is
vastly different than the design range.

High Resistivity 
High dust resistivity is a more common problem than low dust resistivity. Particles
having high resistivity are unable to release or transfer electrical charge. At the collection
plate, the particles neither give up very much of their acquired charge nor easily
pass the corona current to the grounded collection plates. High dust resistivity conditions
are indicated by low primary and secondary voltages, suppressed secondary currents
and high spark rates in all fields. This condition makes it difficult for the T-R

controller to function adequately.
Severe sparking can cause excessive charging off-time, spark "blasting" of particulate
on the plate, broken wires due to electrical erosion, and reduced average current levels.
The reduced current levels generally lead to deteriorated performance. Because
the current level is indicative of the charging process, the low current and voltage levels
that occur inside an ESP operating with high resistivity dust generally reflect
slower charging rates and lower particle migration velocities to the plate. Particle collection
is reduced; consequently, the ESP operates as though it were "undersized." If
high resistivity is expected to continue, the operating conditions can be modified or conditioning agents can be used to accommodate this problem and thereby improve
performance.
High resistivity also tends to promote rapping problems, as the electrical properties of
the dust tend to make it very tenacious. High voltage drop through the dust layer and
the retention of electrical charge by the particles make the dust difficult to remove
because of its strong attraction to the plate. The greater rapping forces usually required
to dislodge the dust may also aggravate or cause a rapping reentrainment problem.
Important items to remember are (1) difficulty in removing the high-resistivity dust is
related to the electrical characteristics, not to the sticky or cohesive nature of the dust;
and (2) the ESP must be able to withstand the necessary increased rapping forces
without sustaining damage to insulators or plate support systems.

Low Resistivity

Low dust resistivity, although not as common, can be just as detrimental to the performance
of an ESP as high resistivity. When particles with low resistivity reach the collection
plate, they release much of their acquired charge and pass the corona current
quite easily to the grounded collection plate. Without the attractive and repulsive electrical
forces that are normally present at normal dust resistivities, the binding forces
between the dust and the plate are considerably weakened. Therefore, particle reentrainment
is a substantial problem at low resistivity, and ESP performance appears to
be very sensitive to contributors of reentrainment, such as poor rapping or poor gas
distribution.
Since there is lower resistance to current flow for particles with low resistivity (compared
to normal or high), lower operating voltages are required to obtain substantial
current flow. Operating voltages and currents are typically close to clean plate conditions,
even when there is some dust accumulation on the plate. Low-resistivity conditions,
are typically characterized by low operating voltages, high current flow, and low
spark rates.
Despite the large flow of current under low-resistivity conditions, the corresponding
low voltages yield lower particle migration velocities to the plate. Thus, particles of a
given size take longer to reach the plate than would be expected. When combined with
substantial dust reentrainment, the result is poor ESP performance. In this case, the
large flow of power to the ESP represents a waste of power.
Low-resistivity problems typically result from the chemical characteristics of the particulate
and not from flue gas temperature. The particulate may be enriched with compounds
that are inherently low in resistivity, either due to poor operation of the process
or to the inherent nature of the process. Examples of such enrichment include excessive
carbon levels in fly ash (due to poor combustion), the presence of naturally occurring
alkalis in wood ash, iron oxide in steel-making operations, or the presence of
other low-resistivity materials in the dust. Over-conditioning may also occur in some
process operations, such as the burning of high-sulfur coals or the presence of high
SO3 levels in the gas stream, which lower the inherent resistivity of the dust. In some
instances, large ESPs with SCAs greater than 750 ft2/1000 acfm have performed
poorly because of the failure to fully account for the difficulty involved in collecting a
low-resistivity dust. Although some corrective actions for low resistivity are available,
they are sometimes more difficult to implement than those for high resistivity.

Problem Evaluation

Good site specific records of both the design and operating history will enable operating personnel
to better evaluate ESP performance. Design parameters built into the ESP include the
following: the specific collection area (SCA), number of fields, number of T-R sets, sectionalization,
T-R set capacity, design velocity and treatment time, aspect ratio and particle characteristics
(resistivity). Design records indicate the specific conditions under which the ESP was
designed to operate. A comparison between design records and operating records indicate
whether operating parameters have changed significantly from the design conditions. Sec-ondly, maintaining proper operating records establishes good baseline information to bracket
normal ranges of operation.
Evaluating ESP operating problems can be difficult and no single parameter can identify all
potential problems; a combination of factors should be considered to accurately pinpoint problems.
For example, although most ESP problems are reflected in the electrical readings, many
different problems produce the same characteristics on the meters. In addition, an initial failure
or problem can cause a "domino effect" bringing about even more problems and making it difficult
to identify the original cause.
The EPA (1985) categorized the major performance problems associated with electrostatic
precipitators into the following seven areas: resistivity, dust buildup, wire breakage, hopper
pluggage, misalignment of ESP components, changes in particle size distribution, and air
inleakage. These problems are related to design limitations, operational changes, and/or maintenance
procedures. The following discussion about the identification of these problems and
their effect on ESP performance is excerpted from the EPA document titled Operation and
Maintenance Manual for Electrostatic Precipitators (1985).

Routine Maintenance and Recordkeeping

While the overall performance of the ESP is continuously monitored by devices such as voltage
meters and transmissometers, the components of the ESP and their operation are periodically
inspected by plant personnel as part of a preventive maintenance program. In this way,
problems are detected and corrected before they cause a major shutdown of the ESP. Of
course, good recordkeeping should be an integral part of any maintenance program.
The frequency of inspection of all ESP components should be established by a formal in-house
maintenance procedure. Vendors' recommendations for an inspection schedule should be followed.
A listing of typical periodic maintenance procedures for an ESP used to collect fly ash
is given in Table
In addition to the daily monitoring of meters and the periodic inspection of ESP components,
some operational checks should be performed every shift and the findings should be recorded
on a shift data sheet. At the end of every shift, these shift data sheets should be evaluated for
maintenance needs. These once-per-shift checkpoints include an inspection of rappers, dust
discharge systems, and T-R sets for proper functioning and an indication of which T-R sets are
in the "off" position. Rappers that are not functioning should be scheduled for maintenance,
particularly if large sections of rappers are out of service. Dust discharge systems should have
highest priority for repair; dust should not accumulate in the bottom of the ESP for long periods
of time because of the potential for causing severe plate misalignment problems. Hopper
heaters can usually be repaired with little difficulty after removing weather protection and
insulation. Insulator heaters may be difficult to repair except during short outages. Hopper
heaters keep condensation on the insulators to a minimum and help keep the dust warm and
free-flowing.
In addition to performing maintenance, keeping records of the actions taken is also important.
For example, wire replacement diagrams should be kept. Although an ESP can operate effectively
with up to 10% of its wires removed, care must be taken that no more than 5 to 10 wires
in any one gas lane are removed. The loss of wires down any one lane can result in a substantial
increase in emissions. The only way to adequately track where wires have failed or slipped
out of the ESP is with a wire replacement chart. Also, any adjustments to the rapper frequency
and intensity should be recorded along with any repairs. These same recordkeeping practices
should be followed for any repairs or replacements made on T-R sets, insulator/heaters, alignment,
and the dust discharge systems.
Preventive maintenance checklist for a typical
fly ash precipitator

Gas-Load Curves

The gas-load V-I curve, on the other hand, is generated during the normal operation of the
process while the ESP is energized. The procedure for generating the gas-load V-I curve is
the same as for the air load except that gas-load V-I curves are always generated from the
outlet fields first and move toward the inlet. This prevents the upstream flow that is being
checked from disturbing the V-I curve of the downstream field readings. Although such
disturbances would be short-lived (usually 2 minutes, but sometimes lasting up to 20 minutes),
working from outlet to inlet speeds up the process.
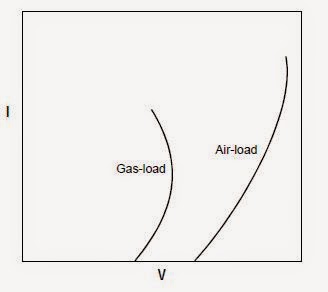
The curves generated under gas-load conditions will be similar to air-load curves. Gasload
curves will generally be shifted to the left however, because sparking occurs at lower
voltage and current when particles are present. The shape of the curve will be different for
each field depending on the presence of particulate matter in the gas stream (see
Figure
Comparison of typical air-load and gas-load
V-I curves

Also, gas-load curves vary from day to day, even minute to minute. Curve positions may
change as a result of fluctuations in the following:
• Amount of dust on plates
• Gasflow
• Particulate chemistry loading
• Temperature
• Resistivity
Nonetheless, they still should maintain a characteristic pattern. Gas-load curves are normally
used to isolate the cause of a suspected problem rather than being used on a day-today
basis; however, they can be used daily if necessary.

Air-Load Curves

Air-load tests are generally conducted on cool, inoperative ESPs through which no gas is
flowing. This test should be conducted when the ESP is new, after the first shutdown, and
every time off-line maintenance is performed on the ESP. These air-load V-I curves serve
as the basis for comparison in the evaluation of ESP maintenance and performance. A typical
air-load curve is shown in Figure
Typical air-load voltage and current readings
An air-load V-I curve can be generated with readings from either primary or secondary
meters. The following procedures can be used by the ESP operator to develop an air-load
curve.
1. Energize a de-energized T-R set on manual control (but with zero voltage and current),
and increase the power to the T-R set manually.
2. At corona initiation the meters should suddenly jump and the voltage and near zero
current levels should be recorded. It is sometimes difficult to identify this point precisely,
so the lowest practical value should be recorded.
3. After corona initiation is achieved, increase the power at predetermined increments
[for example, every 50 or 100 milliamps of secondary current or every 10 volts of AC
primary voltage (the increment is discretionary)], and record the values for voltage
and current.
4. Continue this procedure until one of the following occurs:
• Sparking
• Current limit is achieved
• Voltage limit is achieved
5. Repeat this procedure for each T-R set.
When the air-load tests have been completed for each field, plot each field's voltage/current
curves. When ESPs are equipped with identical fields throughout, the curves for each
field should be nearly identical. In most cases, the curves also should be similar to those
generated when the unit was new, but shifted slightly to the right due to residual dust on
the wires (or rigid frames) and plates of older units. These curves should become part of
the permanent record of the ESP.
The use of air-load curves enables plant personnel to identify which field(s) may not be
performing as designed. Also, comparison of air-load curves from test runs taken just
before and after a unit is serviced will confirm whether the maintenance work corrected
the problem(s).
One major advantage of air-load tests is that they are performed under nearly identical
conditions each time, which means the curves can be compared. One disadvantage is that
the internal ESP conditions are not always the same as during normal operation. For
example, misalignment of electrodes may appear or disappear when the ESP is cooled
(expansion/contraction), and dust buildup may be removed by rapping during ESP shutdown.

Evaluating Air-Load/Gas-Load Voltage-Current (V-I) Curves

In addition to the routine panel meter readings, other electrical tests of interest to personnel
responsible for evaluating and maintaining ESPs include the air-load and gas-load V-I (voltage-
current) tests, which may be conducted on virtually all ESPs. Air-load and gas-load curves
are graphs of the voltage (kV) versus the current (mA) values obtained at a set condition (test
point). These curves are developed to evaluate ESP performance by comparing the graphs
from inlet field to outlet field and over periods in time. Deviation from the normal or previous
results can indicate that a problem exists.

Gas Flow Rate and Distribution

Gas flow rate determines most of the key design and operating parameters such as specific
collection area (ft2/1000 acfm), gas velocity (ft/sec) and treatment time within the
ESP, and specific corona power (watts/1000 acfm). The operator should calculate the flue
gas flow rate if the ESP is not operating efficiently. For example, significant variations in
oxygen may indicate large swings in the gas flow rate that may decrease ESP performance
and indicate the need to routinely determine ESP gas volume. Low SCA values, high
velocities, short gas treatment times (5 seconds or less), and much higher oxygen levels at
nearly full load conditions are indicators that excess flue gas flow rate may be causing
decreased ESP performance.
Presently, most sources do not continuously measure gas velocities or flow rates. Gas
velocities are generally only measured during emission compliance testing or when there
is a perceived problem. Manual pitot tube traverses are normally used to measure gas
velocity (EPA Reference Methods 1 and 2). Because of new technologies and regulations,
some of the larger sources are beginning to install continuous flow measurement systems.
Multi-point pitot devices, ultrasonic devices, and temperature-based flow devices can be
used to continuously measure gas velocity. These devices must be calibrated to the individual
stack where they are installed. Most existing facilities currently use indirect indicators
to estimate gas flow rate; these include fan operating parameters, production rates or
oxygen/carbon dioxide gas concentration levels. However, EPA is now requiring large
coal-fired utility boilers to install and certify flow monitors (EPA Acid Rain Program, Part
75 Regulations).
Another important parameter is gas flow distribution through the ESP. Ideally, the gas
flow should be uniformly distributed throughout the ESP (top to bottom, side to side).
Actually, however, gas flow through the ESP is not evenly distributed, and ESP manufacturers
settle for what they consider an acceptable variation. Standards recommended by the Industrial Gas Cleaning Institute have been set for gas flow distribution. Based on a
velocity sampling routine, 85% of the points should be within 15% of the average velocity
and 99% should be within 1.4 times the average velocity. Generally, uneven gas flow
through the ESP results in reduced performance because the reduction in collection efficiency
in areas of high gas flow is not compensated for by the improved performance in
areas of lower flow. Also, improper gas distribution can also affect gas sneakage through
the ESP. As stated earlier, good gas distribution can be accomplished by using perforated
plates in the inlet plenum and turning vanes in the ductwork.
Measurement of gas flow distribution through the ESP is even less common than measuring
flue gas flow rate. Because the flow measurements are obtained in the ESP rather than
the ductwork (where total gas volumetric flow rates are usually measured), more sensitive
instrumentation is needed for measuring the low gas velocities. The instrument typically
specified is a calibrated hot-wire anemometer. The anemometer test is usually performed
at some mid-point between the inlet and outlet (usually between two fields). Care must be
taken to assure that internal ESP structural members do not interfere with the sampling
points.
Gas flow distribution tests are conducted when the process is inoperative, and the ESP and
ductwork are relatively cool. This often limits the amount of gas volume that can be drawn
through the ESP to less than 50% of the normal operating flow; however, the relative
velocities at each point are assumed to remain the same throughout the normal operating
range of the ESP. A large number of points are sampled by this technique. The actual number
depends upon the ESP design, but 200 to 500 individual readings per ESP are not
unusual. By using a good sampling protocol, any severe variations should become readily
apparent

Gas Temperature

Monitoring the temperature of the gas stream can provide useful information concerning
ESP performance. Temperature is measured using a thermocouple in conjunction with a
digital, analog, or strip chart recorder. Temperature is usually measured using a single point
probe or thermocouple. This method has a major limitation in that the probe may be placed at an unrepresentative (stratified) point—one that is not representative of the bulk
gas flow. Most ESPs are designed with a minimum of three fields. The gas temperature for
each field should be measured at both the inlet and outlet, if possible. Significant temperature
changes between the inlet and outlet values may indicate air inleakage problems that
should be confirmed by measurement of gas composition.
Changes in gas temperature can have profound effects on ESP performance. The temperature
variation can be very small (in some cases as little as 15oF) and yet cause a significant
change in ESP power levels and opacity. Although gas temperature variations may have
some effect on corona discharge characteristics and physical characteristics of the ESP
(corrosion, expansion/contraction), their most important effect is on particle resistivity.
For sources with the potential for high resistivity, temperature changes can cause dramatic
changes in performance, even when all other parameters seem to be the same. The gas
temperature should be checked once per shift for smaller sources and measured continuously
on larger sources and on those sources with temperature-sensitive performance.
Temperature measurement can also be a useful tool in finding excessive inleakage or
unequal gas flow through the ESP. Both of these conditions can affect localized gas velocity
patterns without noticeably affecting the average velocity within the ESP. Yet, localized
changes in gas velocities can reduce ESP performance even though the average gas
velocity seems adequate.

Opacity

In many situations, ESP operation is evaluated in terms of the opacity monitored by a
transmissometer (opacity monitor) on a real-time basis. Under optimum conditions the
ESP should be able to operate at some base-level opacity with a minimum of opacity spiking
from rapper reentrainment. A facility can have one or more monitors that indicate
opacity from various ESP outlet ducts and from the stack.
An opacity monitor compares the amount of light generated and transmitted by the instrument
on one side of the gas stream with the quantity measured by the receiver on the other
side of the gas stream. The difference, which is caused by absorption, reflection, refraction,
and light scattering by the particles in the gas stream, is the opacity of the gas stream.
Opacity is expressed as a percent from 0 to 100% and is a function of particle size, concentration,
and path length.
Most of the opacity monitors being installed today are double-pass monitors; that is, the
light beam is passed through the gas stream and reflected back across to a transceiver. This
arrangement is advantageous for several reasons:
1. Automatic checking of the zero and span of the monitor is possible when the process is            operational.
2. The monitor is more sensitive to slight variations in opacity because the path length is longer.
3. The entire electronics package is located on one side of the stack as a transceiver.

Although single-pass transmissometers are available at a lower cost (and sensitivity), the
single-pass monitors cannot meet the requirements in EPA Performance Specification 1,
Appendix B, 40 CFR 60.
For many sources, dust concentration and opacity correlations can be developed to provide
a relative indication of ESP performance. These correlations are very site-specific,
but can provide plant and agency personnel with an indication of relative performance for
given opacity levels. In addition, site-specific opacity charts can be used to predict deterioration
of ESP performance that requires attention by plant personnel. Readings from
opacity monitors can also be used to optimize spark rate, voltage/current levels, and rapping
cycles, even though the conditions within the ESP are not static. In high-efficiency
ESPs, reentrainment may account for 50 to 70% of the total outlet emissions. Therefore,
optimization of the rapping pattern may prove more beneficial than trying to optimize the
voltage, current and sparking levels. Dust reentrainment from rapping must be observed
by using the opacity monitor operating in a real-time or nonintegrating mode because rapping
spikes tend to get smoothed out in integrated averages such as the 6-minute average
commonly in use. However, the integrated average does provide a good indication of average
opacity and emissions.
When parallel ESPs or chambers are used, an opacity monitor is often placed in each outlet
duct, as well as on the stack, to measure the opacity of the combined emissions.
Although the stack monitor is commonly used to indicate stack opacity (averaging opacities
from different ducts can be difficult), the individual duct monitors can be useful in
indicating the performance of each ESP or chamber and in troubleshooting. Although this
option is often not required and represents an additional expense, it can be very useful,
particularly on relatively large ESPs.
New systems, such as the digital microprocessor design, are available in which the opacity
monitor data can be used as input for the T-R controller. In this case, the data are used to
control power input throughout the ESP to maintain an opacity level preselected by the
source. If the opacity increases, the controller increases power input accordingly until the
opacity limit, spark limit, current limit, or voltage limit is reached. This system (often sold
as an energy saver because it uses only the power required) can save a substantial quantity
of energy:
1. On large, high-efficiency ESPs
2. For processes operating at reduced gas loads.
In many cases, however, reduction of ESP power does not significantly alter ESP performance
because dust reentrainment and gas sneakage constitute the largest sources of emissions;
additional power often does not reduce these emissions significantly. In some
observed cases, reducing power by one-half did not change the performance. For units
typically operated at 1000 to 1500 watts/1000 acfm, operating the ESPs at power levels of
500 to 750 watts/1000 afcm still provide acceptable collection efficiencies.

Voltage and Current

Voltage and current values for each T-R set should be recorded; they indicate ESP performance
more than any other parameter. Most modern ESPs are equipped with primary voltage
and current meters on the low-voltage (a.c.) side of the transformer and secondary
voltage and current meters on the high-voltage rectified (d.c.) side of the transformer.
When both voltage and current meters are available on the T-R control cabinet, these values
can be multiplied to estimate the power input to the ESP. (Note that the primary current reading is multiplied by the primary voltage reading and the secondary current
reading is multiplied by the secondary voltage reading). These values (current times voltage)
represent the number of watts being drawn by the ESP and is referred to as the corona
power input. In addition, whenever a short term spark occurs in a field it can be detected
and counted by a spark rate meter. ESPs generally have spark rate meters to aid in the performance
evaluation.
The power input on the primary versus the secondary side of the T-R set will differ
because of the circuitry and metering of these values. The secondary power outlet (in
watts) is always less than the primary power input to the T-R. The ratio of the secondary
power to the primary power will range from 0.5 to 0.9 and average from 0.70 to 0.75 (U.S.
EPA 1985).
Voltage and current values for each individual T-R set are useful because they inform the
operators how effectively each field is operating. However, the trends noted within the
entire ESP are more important. T-R set readings for current, voltage, and sparking rates
should follow certain patterns from the inlet to the outlet fields. For example, corona
power density should increase from inlet to outlet fields as the particulate matter is
removed from the gas stream.
The electrical meters on the T-R cabinets are always fluctuating. Normal sparking within
the ESP causes these fluctuations in the meter readings. These short term movements of
the gauges indicate that the automatic voltage controller is restoring the maximum voltage
after shutting down for several milliseconds to quench the spark. When recording values
of the electrical data from the T-R meters it is important to note the maximum value that is
sustained for at least a fraction of a second.

Performance Monitoring

As with the operation of any piece of equipment, performance monitoring and recordkeeping
are essential to establishing a good operation and maintenance program. The key to any monitoring
program is establishing an adequate baseline of acceptable ranges that is used as a reference
point. Then, by monitoring and recording key operating parameters, the operator can
identify performance problems, need for maintenance, and operating trends.
Typical parameters that can be monitored include:
• Voltage/current
• Opacity
• Gas temperature
• Gas flow rate and distribution
• Gas composition and moisture
In addition, site-specific data on process operating rates and conditioning system (if used)
should also be documented. Operators should not rely on just one parameter as an indicator of
performance—trends for a number of parameters gives a clearer picture. Let's briefly look at
the ways these parameters affect performance and the techniques used to measure them. Much
of this information was extracted from Operation and Maintenance Manual for Electrostatic
Precipitators (U.S. EPA 1985).

ESP Startup and Shutdown

A specific startup and shutdown procedure should be supplied by the ESP vendor. Improper
startup and shutdown can damage the collector. It is imperative for the operator (source) to
have a copy of these procedures. Review agency engineers may want to assure that these procedures exist at the sites and that the operators follow the procedures or document reasons for
deviations.
Startup
Startup of an electrostatic precipitator is generally a routine operation. It involves heating
a number of components such as support insulators and hoppers. If possible, the ESP
should not be turned on until the process reaches steady-state conditions. As described in
Lesson 5, this is particularly important for ESPs used on cement kilns burning coal as fuel.
The internal arcing of the ESP could cause a fire or an explosion. When ESPs are used on
oil-burning boilers, the boiler should be started with gas or #2 fuel oil. Heavy oil (#6 fuel
oil) is not a good fuel for startup because tarry particulate emissions can coat collection
plates and be difficult to remove. If an ESP is used on a coal-fired boiler, the ESP should
not be started until coal firing can be verified. This will help prevent combustible gases
from accumulating in the unit and causing explosive conditions. A typical startup procedure
for an ESP used on a boiler is given below

Startup (preoperational checks - at least 2 hours prior to gas load):
1. Complete all maintenance/inspection items.
2. Remove all debris from ESP.
3. Safety interlocks should be operational and all keys accounted for.
4. No personnel should be in ESP.
5. Lock out ESP and insert keys in transfer blocks.
Prestart (at least one hour prior to gas load):
6. Check hoppers.
a. Level-indicating system should be operational.
b. Ash-handling system operating and sequence check - leave in operational mode.
c. Hopper heaters should be on.
7. Check top housing seal-air system.
a. Check operation of seal-air fan—leave running.
b. Bushing heaters should be on.
8. Check rappers.
a. Energize control, run rapid sequence, ensure that all rappers are operational.
b. Set cycle time and intensity adjustments, using installed instrumentation—leave rappers operating.
9. Check T-R sets.
a. Check half-wave/full-wave operation (half-wave operation is recommended for filtering fly ash when lignite is burned and a cold-side ESP is used.)
b. Keys should be in all breakers.
c. Test-energize all T-R sets and check local control alarm functions.
d. Set power levels and de-energize all T-R controls.
e. Lamp and function-test all local and remote alarms.
Gas load:
10. After gas at temperature of 200°F has entered ESP for 2 hours -
a. Energize T-R sets.
b. Check for normal operation of T-R control.
c. Check all alarm functions in local and remote.
d. Within 2 hours, check proper operation of ash removal system.
e. De-energize bushing heaters after 2 hours (hopper heaters optional).
Cold start (when it is not possible to admit flue gas at 200°F for 2 hours prior to energizing controls), proceed as follows:
1. Perform steps 1-9 above. Increase rapping intensity 50%.
2. Energize T-R sets, starting with inlet field, setting Powertrac voltage to a point just below sparking.
3. Successively energize successive field as load picks up to maintain opacity, keeping voltage below normal sparking (less than 10 flashes/min on spark indicator).
4. Perform step 10d above.
5. After flue gas at 200°F has entered ESP for 2 hours, perform steps 
       10b, c, d, and e above.
       Set normal rapping.

Shutdown
When an industrial process is shut down temporarily, the ESP system should be de-energized
to save energy. The shutdown of the ESP is usually done by reversing the order of
the startup steps. Begin with de-energizing the ESP fields starting with the inlet field to
maintain appropriate opacity levels from the stack. The rappers should be run for a short
time after the ESP is de-energized so that accumulated dust from the collection plates and
discharge wires can be removed. All hoppers should be emptied completely before bringing
the unit back on line. A typical shutdown and emergency shutdown procedure for
ESPs used on industrial sources is given below

Typical shutdown
1. When boiler load drops and total ash quantity diminishes:
a. De-energize ESP by field, starting with inlet field to maintain opacity limit.
b. De-energize outlet field when all fuel flow ceases and combustion air flow falls below 30% of rated flow.
c. Leave rappers, ash removal system, seal-air system, and hopper heaters operational.
d. Four hours after boiler shutdown, de-energize seal-air system and hopper heaters. Secure ash removal system.
e. Eight hours after boiler shutdown, de-energize rappers.
Note: Normal shutdown is a convenient time to check operation of alarms.

Emergency shutdown
1. De-energize all T-R sets.
2. Follow steps 1c, d, and e above (shutdown).